My Dan Pallotta Inspired Halloween Costume: I’m Overhead

My Dan Pallotta Inspired Halloween Costume: I’m Overhead

I’m personally and professionally fascinated by analytics and the idea of return on investment (ROI). I spend my working days in Google Analytics, Facebook and YouTube Insights, e-newsletter stats and more.

When it comes to my personal giving to non-profits, I’m just as intrigued by numbers.  I tend to “invest” my thoughts, energy, time and finances quite vertically: I drive deeply down into issues and give there, rather than here and there to many causes.

In doing this, I come across terms like effectiveness, efficiency and overhead, which are very often cited by non-profits as reasons to believe an organization is “good.” This is, of course, in addition to (and sometimes an after-thought to!) the actual impact an organization has.

Keep reading →

Why LinkedIn “Skills” Are Useless – and What LinkedIn Can Do About It

Why LinkedIn “Skills” Are Useless – and What LinkedIn Can Do About It

LinkedIn makes it very easy to add new skills to your professional profile – and this is what makes this section of the site irrelevant.

As of today, I have 11 skills for which colleagues have endorsed me. By clicking “Add to Profile,” these words will quickly appear on my profile and position me as an expert in Facebook, WordPress, Teaching, Research and more.

Facebook? Yes, I’m a pro. WordPress? Yes, I’m very good at that too. Teaching?  Well, I’ve run some good workshops and I enjoy mentoring, but I dislike most forms of “teaching” and wouldn’t use that word to describe my skills. Research?  Hmm, I like to learn and I Google a heck of a lot of stuff every day. Does that make me skilled at research?

Keep reading →

Getting to Zero Waste: Q3 Results

Getting to Zero Waste: Q3 Results

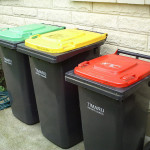
I rushed home from work today to weigh my trash. I know, I’m weird like that: driven by results, a bit of environmentalism, and in love with personal experiments. It’s the end of the third quarter and the weigh-in must be done, as I attempt to get myself closer and closer to zero waste.

Without further ado, in the third quarter of 2013 (July-September), I tossed out:

  • 20 lbs of paper
  • 21 lbs of trash
  • 12.5 lbs of plastic & glass
  • 53.5 total lbs of trash = 0.48 lbs / day

To compare the quarters, it looks like this:

Keep reading →

Social Media Image Sizing Cheat Sheet

Social Media Image Sizing Cheat Sheet

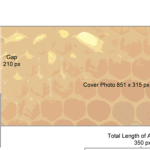
Properly sizing a social media image, whether a Facebook cover, Twitter profile photo, or custom YouTube thumbnail, can be the bane of any marketers existence.

Just looking at this infographic and all of the details that go into properly imaging social media accounts makes my head hurt.

But thanks to this cheat sheet from LunaMetrics, I’ve got a quick and handy reference:

Keep reading →

Rafflecopter: The best times to run raffles and giveaways

Rafflecopter: The best times to run raffles and giveaways

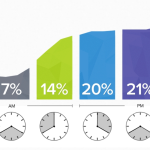
Rafflecopter is the world’s easiest way to run a giveaway.” Especially on social media, raffles are a great way to encourage and reward engagement as well as, possibly, increase followers or subscribers.

I’ve run two giveaways in the past year and have been really satisfied with the experience. I’ve kept things pretty simple by asking for Facebook Likes, Twitter follows, tweets and e-newsletter sign-ups, in return for packages of freebies designed for chefs, commuters, athletic folks, teachers, and anyone interested in a free baseball cap, coffee mug, etc.

Keep reading →

Getting to Zero Waste: Q2 Results

Getting to Zero Waste: Q2 Results

I’ve been chronicling my attempts to get down to zero waste this year and it’s been an eye-opening experience. In the first quarter of the year (January-March), I averaged 0.79 lbs of trash per day. This included food scraps, plastic, paper, glass, and anything else I took down to the garbage cans. You can see the details and category breakdown here.

Fortunately, this is much lower than the American 4.4 lbs per day average, but still much more than I’d like to be responsible for. So I continue to keep track.

In the second quarter of the year (April-June), I averaged:

Keep reading →